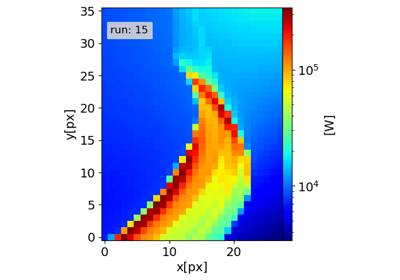
Examples#
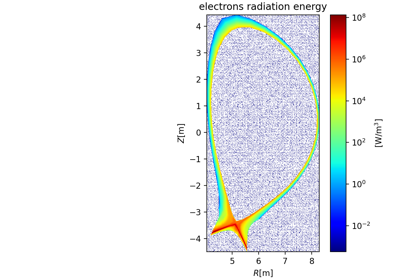
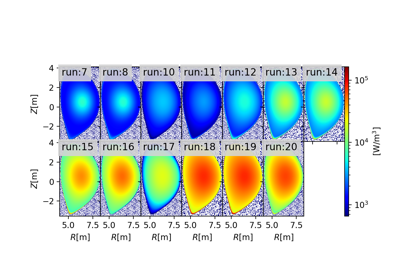
This page contains example scripts. Click on any image to see the full image and source code.
IMAS#
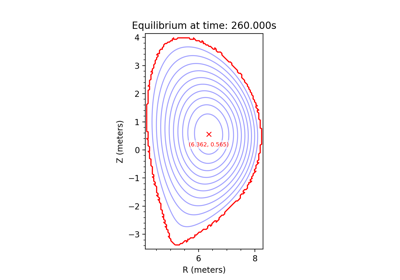
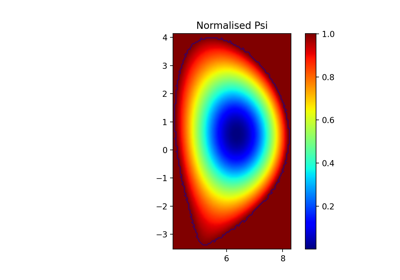
Plot equilibrium information stored in IMAS database
Plot equilibrium information stored in IMAS database
This page contains example scripts. Click on any image to see the full image and source code.
Plot equilibrium information stored in IMAS database