Note
Click here to download the full example code
2D profiles stored in edge_profiles ids


Out:
loading edge solution from shot:134000, run:27
WARNING: velocity for electrons is not specified in edge_profiles IDS, setting it to zero.
WARNING: could not determine a charge for ion species 'D' from edge_profiles IDS, skipping this species.
WARNING: could not determine a charge for ion species 'Be' from edge_profiles IDS, skipping this species.
WARNING: could not determine a charge for ion species 'Ne' from edge_profiles IDS, skipping this species.
WARNING: velocity for neutral species D is not specified in edge_profiles IDS, setting it to zero.
WARNING: velocity for neutral species Be is not specified in edge_profiles IDS, setting it to zero.
WARNING: velocity for neutral species Ne is not specified in edge_profiles IDS, setting it to zero.
WARNING: velocity for neutral species D is not specified in edge_profiles IDS, setting it to zero.
import numpy as np
from matplotlib import pyplot as plt
from cherab.core.math import sample3d
from cherab.imas import EdgeProfilesIDS
# IDS Setting
SHOT = 134000
RUN = 27
USER = "koyo"
DATABASE = "iter"
print("loading edge solution from shot:{}, run:{}".format(SHOT, RUN))
# Kukushkin SOLPS Case
edge_ids = EdgeProfilesIDS(shot=SHOT, run=RUN, user=USER, database=DATABASE)
edge_plasma = edge_ids.create_plasma(0)
# plot equilibrium
rmin, rmax = (3.7, 8.7)
zmin, zmax = (-4.5, 4.5)
# sample every 1 cm
resolution = 0.01
nr = round((rmax - rmin) / resolution)
nz = round((zmax - zmin) / resolution)
try:
plt.figure()
plt.axes(aspect="equal")
r, _, z, ne_samples = sample3d(
edge_plasma.electron_distribution.density, (rmin, rmax, nr), (0, 0, 1), (zmin, zmax, nz)
)
plt.imshow(np.transpose(np.squeeze(ne_samples)), extent=[rmin, rmax, zmin, zmax], origin="lower")
plt.colorbar()
plt.autoscale(tight=True)
plt.xlim(rmin, rmax)
plt.ylim(zmin, zmax)
plt.title("electron density")
plt.figure()
plt.axes(aspect="equal")
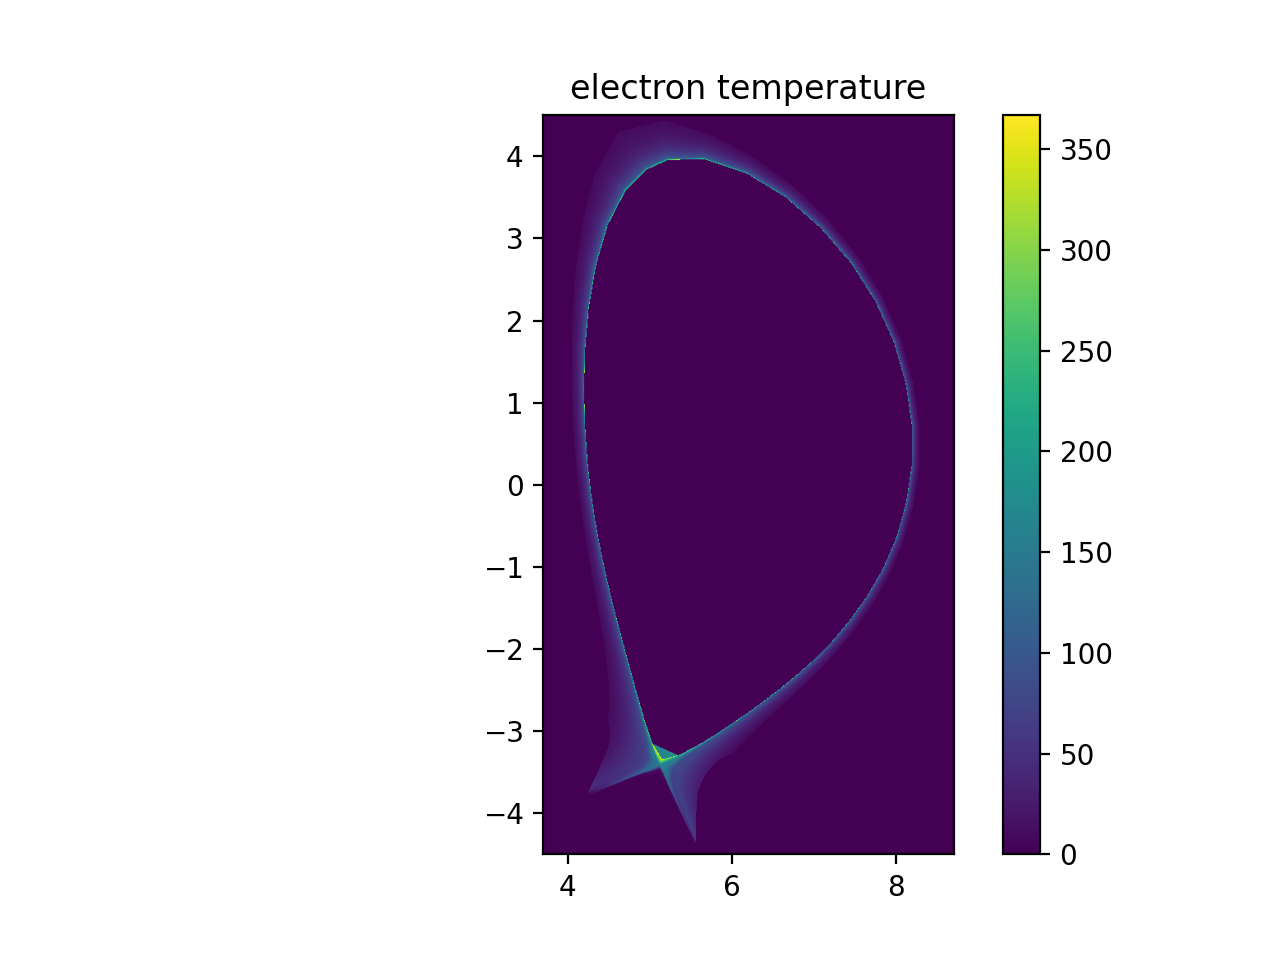
r, _, z, te_samples = sample3d(
edge_plasma.electron_distribution.effective_temperature, (rmin, rmax, nr), (0, 0, 1), (zmin, zmax, nz)
)
plt.imshow(np.transpose(np.squeeze(te_samples)), extent=[rmin, rmax, zmin, zmax], origin="lower")
plt.colorbar()
plt.autoscale(tight=True)
plt.xlim(rmin, rmax)
plt.ylim(zmin, zmax)
plt.title("electron temperature")
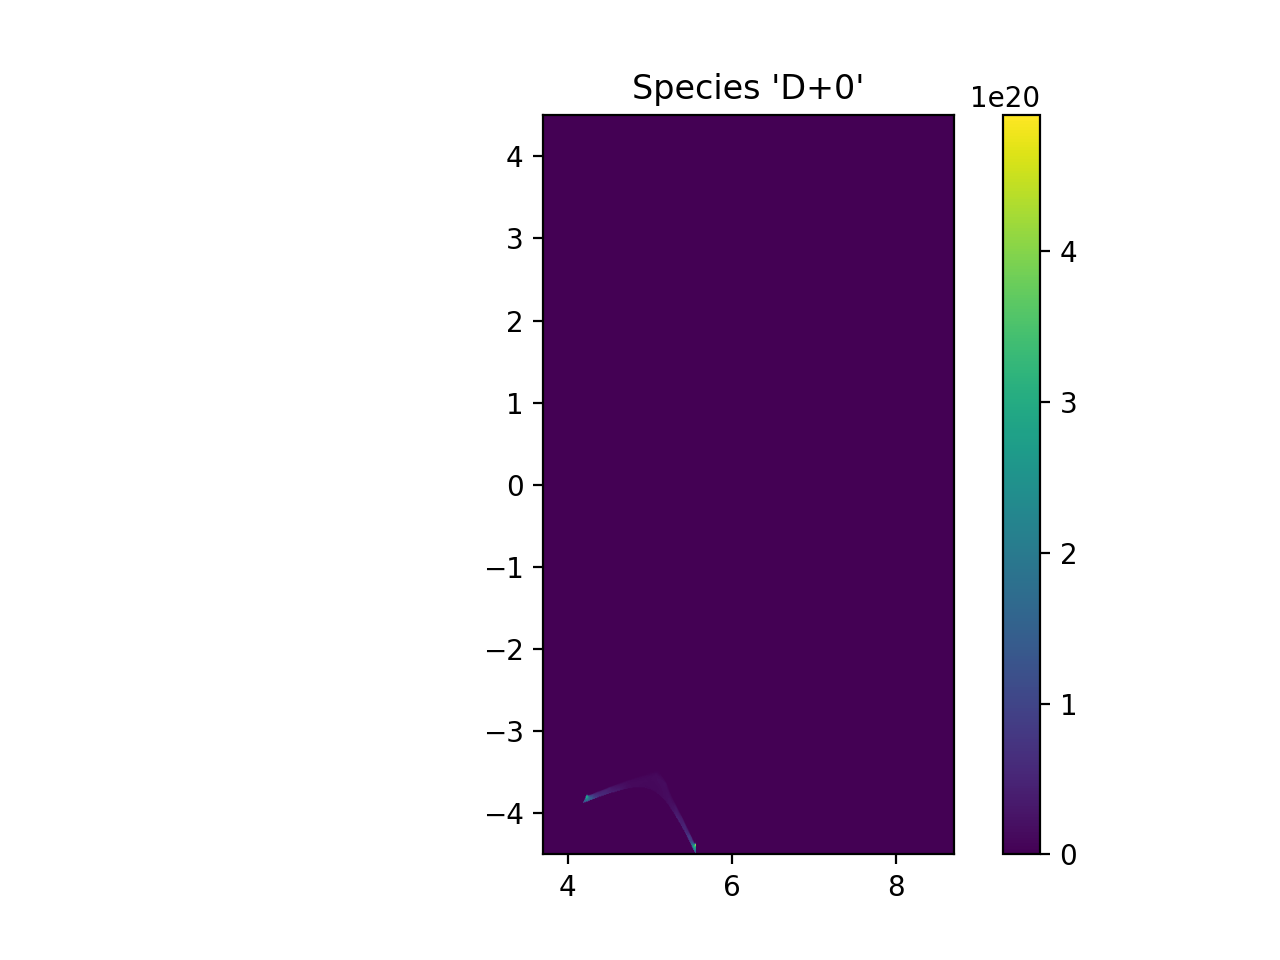
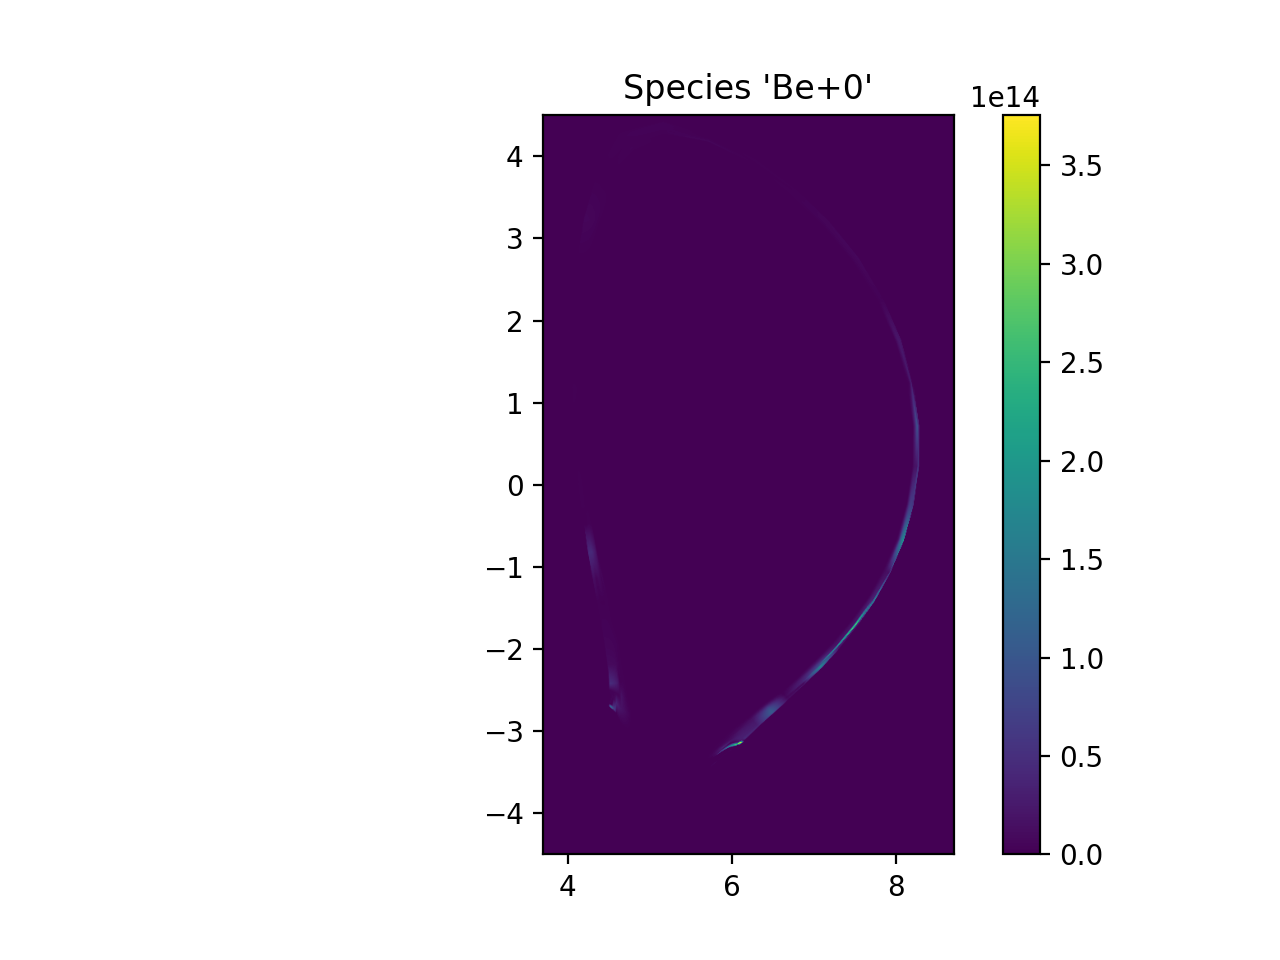
for species in edge_plasma.composition:
r, _, z, ni_samples = sample3d(species.distribution.density, (rmin, rmax, nr), (0, 0, 1), (zmin, zmax, nz))
plt.figure()
plt.axes(aspect="equal")
plt.imshow(np.transpose(np.squeeze(ni_samples)), extent=[rmin, rmax, zmin, zmax], origin="lower")
plt.colorbar()
plt.autoscale(tight=True)
plt.xlim(rmin, rmax)
plt.ylim(zmin, zmax)
plt.title("Species '{}+{}'".format(species.element.symbol, species.charge))
finally:
plt.draw()
plt.show()
Total running time of the script: ( 0 minutes 0.000 seconds)